GJI_1.png
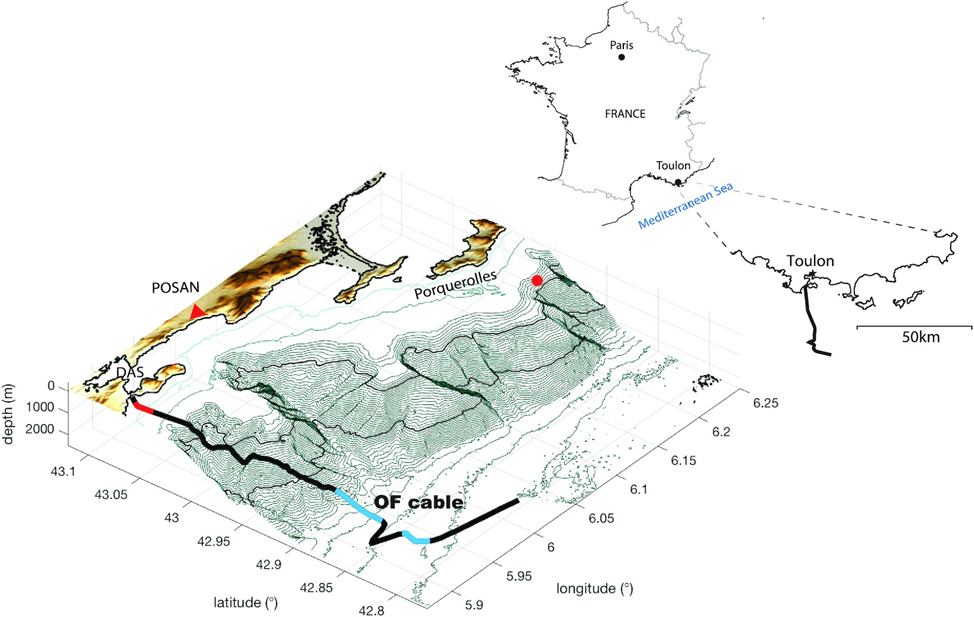
Map and perspective view of the seafloor MEUST- NUMerEnv cable (black curve). The red section is used to generate the f–k analyses in Fig. 5 of the paper, and the blue sections are used in Fig. 6. The Porquerolles oceanographic buoy is indicated by the red circle. The red triangle is the permanent seismic station POSAN.
Guerin et al.
Licence type